Cargando...
Recursos educativos
-
Nivel educativo
-
Competencias
-
Tipología
-
Idioma
-
Tipo de medio
-
Tipo de actividad
-
Destinatarios
-
Tipo de audiencia
-
Creador
Lo más buscado
- Huerto escolar
- Actividades de lengua para imprimir
- Leonardo da Vinci
- Actividades poesía
- verbos en inglés
- Ejercicios escolares para niños de 8 años
- Arte gótico para primero
- Derechos de las mujeres
- Repaso de tiempos verbales en inglés
- Herramientas para física
- Juegos geográficos para educación secundaria
- Imprimir material sexto grado
- Actividades didacticas
- Experimentos para casa
- Europa hasta el año mil
-
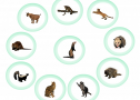
Mammals picture chart
Tiching explorer Organización
- 1 lo usan
- 1230 visitas
Interactive resource designed to help us learn vocabulary associated to mammals.
-

Interactive Phonemic Chart | EnglishClub SM
Francisco Cerrillo Docente
- 1 lo usan
- 1899 visitas
Click to hear each symbol and sample word. This interactive phonemic chart contains all 44 sounds used in spoken British English (Received Pronunciation).
-

Blog: Adrian’s Pron Chart Blog
Tiching explorer Organización
- 1 lo usan
- 2902 visitas
This blog is focused on pronunciation. Phonetic and phonological aspects are deeply developed in this blog.
-

Interpret. Climate chart for Santander
EduBook Organización
- 1735 visitas
Look at the graph and answer the questions. What is the average temperature in the hottest months in Santander? And in the coldest months? In which month does it rain the most? And the least?
-

Interpret. Climate chart for Madrid
EduBook Organización
- 1740 visitas
Look at the climate chart for Madrid and answer the questions. What is the average temperature in the hottest month in Madrid? And in the coldest month? In which month does it rain the most? And the least?
-

Interpret. Climate chart for Malaga
EduBook Organización
- 1658 visitas
Look at the graph and answer the questions: What is the average temperature of the hottest month in Malaga? In which month does it rain the most? And the least?
-

Interpret. Climate chart for Leitariegos
EduBook Organización
- 1646 visitas
Look at the graph and answer the questions: What is the average temperature in the hottest month? And in the coldest month? In which month does it rain the most? And the least?
-

Learn. Make a climate chart
EduBook Organización
- 1539 visitas
Make a climate chart A climate chart shows the weather conditions in a particular area over a period of time. We are going to make a climate chart with the temperatures and precipitation that are listed…
-

Causes of the French Revolution (Chart)
Anabel Sánchez Docente
- 2 lo usan
- 2121 visitas
Chart. Easy to understand!
-
http://www.antimoon.com/how/pronunc-soundsipa.htm#chart
Meritxell Ribas Docente
- 2249 visitas


Te estamos redirigiendo a la ficha del libro...
